Do It Yourself!: Building a Histogram
Histogram Demo
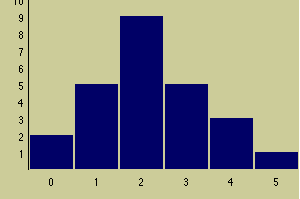
Table 1.11 in the text lists the number of quarts of milk purchased by 25 households for a given week. Construct a histogram of these data by clicking in the appropriate column in the applet below for each count. For example, for the first value of 0, click in the 0 column. For the next value of 3, click in the 3 column, and so on. As you move the cursor across the applet, a light gray box will show you where the next click will add a box to the histogram.Quarts of Milk Purchased
| 0 | 3 | 5 | 4 | 3 |
| 2 | 1 | 3 | 1 | 2 |
| 1 | 1 | 2 | 0 | 1 |
| 4 | 3 | 2 | 2 | 2 |
| 2 | 2 | 2 | 3 | 4 |
Illustration of Completed Histogram
Do It Yourself
- Click in a column to add one to the count for that column. The column that will receive the count will be highlighted with a light gray box.
- To remove a count from a column, hold down the shift key while clicking in that column.
- Click on your browser's Refresh or Reload button to reset the applet to zero counts in all columns.
Return to the index of applets
The applet(s) on this page is from Seeing Statistics,™ an online, interactive statistics textbook. Seeing Statistics is a registered service mark used herein under license. The applet(s) on this page was designed to be used exclusively with Introduction to Probability and Statistics, Eleventh Edition, by Mendenhall, Beaver, & Beaver. (c) 2003, Duxbury Thomson Learning. The applet(s) on this page may not be copied, duplicated, or reproduced for any reason.